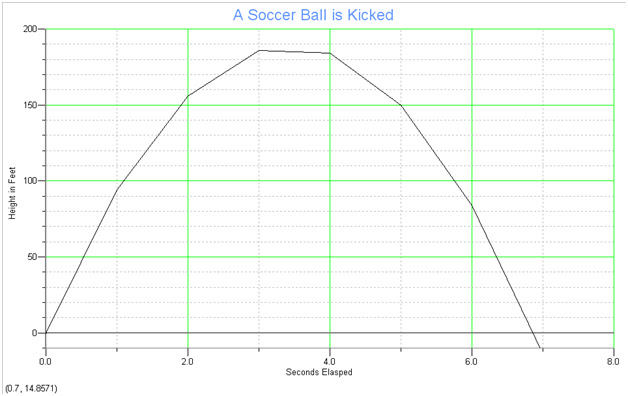
In the first part of the lab we made an equation (-16x^2+110t) as shown in the above graph. We gave it a title, y &x axis labels, and units.
In the second part of the lab. We used a sonar motion detector attached to the Lab Pro
Motion Detector (left) Lab Pro (right)
We threw a ball up and let it drop while measuring time elasped and distance traveled. All this was graphed using our software. The graph appears below.
The important part is the porabola shape that appears in red and is highlighted over in black. This equation was shown to be -4.968t^2+8.162t-0.714 where t was time in seconds and numerical values represented distance in meters.
Part II #2
From the equation of our measurements specifically the part (-4.968t^2) n was found to be 2.
Part II #3
Dimentional analysis conferms this [L]=[L]/[T^2]*[T]^n
solving will give you [T]=2
Unit analysis concurs m=m/s^2*s^n
solving yeilds n=2
Part II #2
From the equation of our measurements specifically the part (-4.968t^2) n was found to be 2.
Part II #3
Dimentional analysis conferms this [L]=[L]/[T^2]*[T]^n
solving will give you [T]=2
Unit analysis concurs m=m/s^2*s^n
solving yeilds n=2
Conclusions:
While it can be difficult to understand motion all at once, breaking it up it to small peices can be of immense benifit. In these experiments the objects were thrown straight up and gravity pulled them back down. Looking at the graphs one might think they had been kicked or thrown in an arch patern. This patern comes from the fact that as time elapess it adds a dimention to the graph. Acceleration was negative due to the fact that the motion detector is calibrated to sense velocities/accelerations heading away from it as positive and towards it as negative. It was laying on the ground pointing at the ceiling during our measurements. Therefore it measured acceleration due to gravity as a negative value.


